Program 4 - Temperature Anomoly
Do this assignment individually. We will be handing in the first part of the
program - as a "checkpoint" - on 2/7 and the second part on 2/14.
In this program,
we'll look at some climate change data from the National Oceanic and Atmospheric Administration (the US government agency in charge of weather and climate data, among other things).
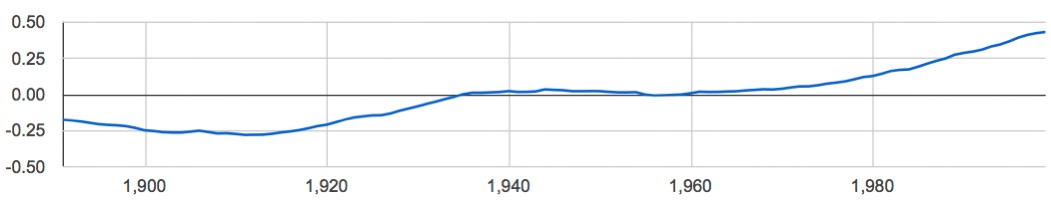
In particular, we'll look at one of the "headline" datasets, global
temperature anomoly over the last century.
By "anomoly" they just mean the difference between the annual average temperature and an single baseline temperature.
In this case they use the average from 1900-2000 as a baseline (although
the data goes from 1880-2012).
They use an average as the baseline, rather than
a single year,
because the temperature varies from year to year.
If you average over a number of years these variations smooth out.
If you average over a century, the result is just one number and you can't
see any trend at all.
Our program will caluclate a moving average of the temperature anomoly
data.
We'll let the user enter an integer k.
Then for each year we calculate the average of the k years before,
the year itself, and the k years after.
that year. For instance, if the user picked k=3, for the year 1936 we
would average the temperatures for 1933, 1934, 1935, 1936, 1937, 1938 and 1939.
Remember that to average seven numbers, we add them up and divide the sum
by seven.
Our program will let the user experiment with averaging over different
time intervals, to get a nice balance between smoothing out
annual variation and
losing the trend entirely.
Requirements
Download the
temperature data at the bottom of this page.
Using Internet Explorer on Windows, right-click on the link and "save as.."
temp.txt on your Desktop or in the folder where you want to work.
You should be able to look at the data in Wordpad, in Windows, or TextEdit
on the Mac
(it looks messed up in Notepad, that's OK).
Your program should ask the user for the number of years over which to
average, and either exit or keep asking if it does not get an integer between
0 and 60.
The output of your program should be a file called
movingAvg.csv. The ending .csv means that
unlike the input file, the output data is separated by commas.
This allows programs like Microsoft Excel, or Google Docs, or the
ManyEyes Website from IBM, to read the data and make a chart.
You are required to hand in a chart
(as a screenshot) as well as your program.
After you get your program running, try a few different choices
of k, make some charts, and see which you think best presents the data.
Example output
Here is an example of the .csv file the program produces when the
user chooses to average over 60 years; there are not too many rows since
there are only 10 years in the middle of the century when there are
60 years before and 60 years after over which to average.
1940,-0.0349371900826
1941,-0.0291066115702
1942,-0.0232082644628
1943,-0.0171115702479
1944,-0.0109479338843
1945,-0.00365537190083
1946,0.00295371900826
1947,0.00933140495868
1948,0.0156661157025
1949,0.0219909090909
1950,0.0281867768595
1951,0.0351082644628
1952,0.0420537190083
On different machines the same program
can produce slightly different floating point results.
So if you get, for instance, "1940,-0.03317438016528924" as the first
line, that is fine.
Step By Step
The overall structure of your program should be two loops: one that reads
the input data, extracts the temperatures, and stores them in a list, and
a second one that computes the moving averages for every item that is not
too close to the ends of the list, and writes them to the output file.
This is a big enough program that you can't just type it in and hope it
will work.
We will break it down into two big steps, and submit the results of
the first step on Tues 25 and the results of the second step on Thurs
2/7.
- For practice, make
a list containing 5 integers, and then write a while loop that
computes the average of the five integers. Save this little program; it will
be the basis for the second loop in your program.
- Now start your program. Let the user pick the integer k.
Use the inputCheck.py module to
help check the user's input number. Make sure it is between 0 and 60.
- Make a while loop that reads in the data file, and prints out
every line.
- Change the block under the while so that it uses the strip() and split()
methods to get only the temperature for each year, and just prints that out.
Change temperature to a floating point number.
- Instead of printing out the floating point numbers, store
them as a list in your program. Lets say the list is called tempList.
- Make your program print out tempList. Then submit this
program, using SmartSite, as "Program 4 checkpoint".
In the second week, we will do the averaging, write out the output file,
and make a chart.
- Start your second
while loop by going through tempList from beginning to end,
and printing out each temperature.
- Now change the block under the while so that it only runs through
tempList[k] through tempList[-(k+1)] and prints them out.
- Now change it so that for each list element it hits, it prints out the
average of the k items before it, the element itself, and the
k items after it. Use the little practice
program you wrote in the first week
as a guide.
- Add a year to your output, so that instead of printing just the temperature, it prints the year, a comma, and then the average temperature for the
time interval surrounding that year.
Notice that the data starts with year 1880.
- Now instead of printing out the years and averages, write them to
file movingAvg.csv.
- To make a chart, one way is to use Google Drive; if you have
Excel or some other spreadsheet program that can make a chart, feel
free to use that instead.
To do it in Google Drive,
go to Google in a Web browser, and click on Drive on the
black menu bar at the top
(you may need to
make a free Google account).
Upload your file movingAvg.csv (with the upload icon just to the right of
the red "Create" button on the left), right-click (Windows) or
control-click (Mac) on it to Open with...
Google Sheets. Now you're in the spreadsheet program. You can
select Insert->chart to make the chart. The "Use column A as labels"
should get the years onto the bottom of the graph.
What to Submit
The first week, just submit your program (to "Program 4 checkpoint").
The second week, submit your program on SmartSite, and also a
screenshot of the chart you made for your favorite value of k.