
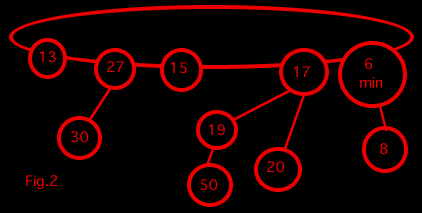


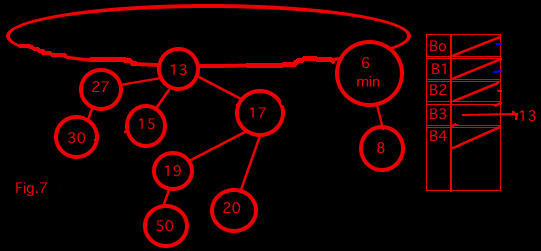
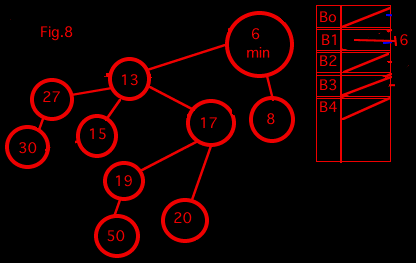
The table on the right in the diagram is a table pointing to binomial trees of different degrees. When we look at a tree, we determine the degree and point to it from the table. If the table is already pointing to a tree of that degree, we combine the two together to make a tree with one degree higher. This means that when we look at the tree containing 15, we already have a tree of degree 0 and so we combine those two trees to get a tree of degree 1.
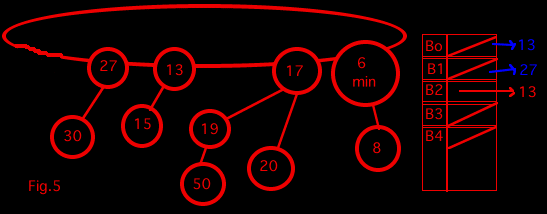
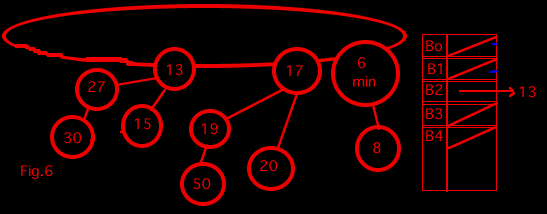
We keep looking at the trees and recombining them from the table until we can do this no more.
Cost of a sequence of t operations(Op1, . . . ,Opt) = cost1 + ... + costt
Actual Cost = Cost of Op1 + change of Pfcn1 + . . .
Actual Cost = AmCost of Op1 + . . .
Actual Cost = AmCost - Pfcnt
Therefore Actual Cost <= AmCost
Note: delta$ is the same as the change in Pfcn (Pfcn and $ are the same thing)
Potential(Pfcn) of the Data Structure = Number of Trees (roots) in it.
t = number of Trees in the data structure.
c = number of tree get combined in deletemin operation.
NUMber of trees after combining = t - c <= Degree of element to delete O(log n).