
 |
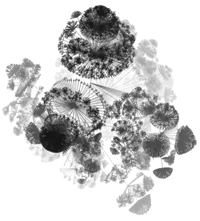
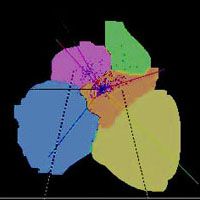
Graph Visualization and Network Analysis Graphs are natural representations for relations. Even though many graph drawing algorithms are available, the scale and complexity of some of the large-scale databases and document collections demand research innovations in graph drawing as well as the accompanied interactive data interrogation techniques. Our research is beyond the traditional graph drawing work because we address more the user interface and interaction aspects of problem. We have also developed visual analytics techniques for understanding networks. Publications:Visual Reasoning about Social Networks using Centrality Sensitivities Carlos Correa, Tarik Crnovsanin, and Kwan-Liu Ma. (accepted for publication, 11/01/2010) IEEE Transactions on Visualization and Computer Graphics. [The pdf file will be available soon.] Social Network Discovery based on Sensitivity Analysis. Tarik Crnovsanin, Carlos Correa, and Kwan-Liu Ma. In Proceedings of International Conference on Advances in Social Networks Analysis and Mining, July 2009. [pdf] A Hybrid Space-Filling and Force-Directed Layout Method for Visualizing Multiple-Category Graphs. Takayuki Itoh, Chris Muelder, Kwan-Liu Ma, and Jun Sese. In Proceedings of IEEE Pacific Visualization 2009 Symposium. [pdf] Rapid Graph Layout using Space Filling Curves. Chris Muelder and Kwan-Liu Ma. IEEE Transactions on Visualization and Computer Graphics, 14(6), October 2008, pp. 1301-1308. (Also InfoVis 2008 Proceedings) [DOI] A Scalable Parallel Force-Directed Graph Layout Algorithm. Anna Tikhonova and Kwan-Liu Ma. In Proceedings of Eurographics Parallel Graphics and Visualization Symposium (EGPGV 2008) April, 2008, pp. 25-32. [pdf] Path Visualization for Adjacency Matrices. Zeqian Shen and Kwan-Liu Ma. In Proceedings of EuroVis 2007. [pdf] Visual Analysis of Large Heterogeneous Social Networks by Utilizing Semantics and Structure, Zeqian Shen, Kwan-Liu Ma, and Tina Eliassi-Rad, IEEE Transactions on Visualization and Computer Graphics, special issue on Visual Analytics, Volume 12, Number 6, 2006, pp. 1427-1439. [pdf] Evaluating the Effectiveness of Tree Visualization Systems for Knowledge Discovery, Yue Wang, Soon Tee Teoh, and Kwan-Liu Ma, Proceedings of Eurographics Visualization Symposium, May 8-10, 2006. [pdf] Discovering Parametric Clusters in Social Small-World Graphs, Jonathan McPherson, Kwan-Liu Ma and Micahel Ogawa, ACM Symposium on Applied Computing 2005. [pdf] MoireGraphs: Raidal Focus+Context Visualization and Interaction for Graph with Visual Nodes, T.J. Jankun-Kelly and Kwan-Liu Ma, in Proceedings of Information Visualization 2003 Symposium. [pdf] RINGS: A Techniques for Visualizing Large Hierarchies, Soon Tee Teoh and Kwan-Liu Ma, in Proceedings of Graph Drawing 2002. [pdf] |
|
 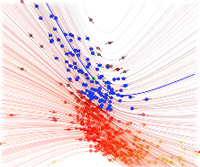 |
Visual Data Mining We study how visual-based approach can help classify and understand high dimensional data, for example, through interactive construction and visualization of decision trees. We also study how to use visualization to examine large amounts of information at different scales. Publications:Flow-Based Scatterplots for Sensitivity Analysis Yu-Hsuan Chan, Carlos Correa, and Kwan-Liu Ma. In Proceedings of IEEE Symposium on Visual Analytics Science and Technology (VAST 2010). [pdf] A Framework for Uncertainty Aware Visual Analytics. Carlos D. Correa, Yu-Hsuan Chan, and Kwan-Liu Ma. In Proceedings of IEEE Symposium on Visual Analytics Science and Technology (VAST 2009). [pdf] Visuaization of Sanitized Email Logs for Spam Analysis, Chris Muelder and Kwan-Liu Ma, submitted to APVIS 2007. [DOI] BiblioViz: A System for Visualizing Bibliography Information, Zeqian Shen, Michael Ogawa, Soon Tee Teoh, and Kwan-Liu Ma, in Proceedings of the 2006 Asia-Pacific Symposium on Infomration Visualization, pp. 93-102. [DOI] Hifocon: Focus+Context in Multidimensional Visualization, Soon Tee Teoh and Kwan-Liu Ma, in Proceedings of the International Symposium on Visual Computing, December 5-7, 2005. [pdf] PaintingClass: Interactive Construction, Visualization and Exploration of Decision Trees, Soon Tee Teoh and Kwan-Liu Ma, in Proceedings of ACM KDD 2003 Conference, August 24-27. [pdf] StarClass: Interactive Visual Classification Using Star Coordinates, Soon Tee Teoh and Kwan-Liu Ma, in Proceedings of the 3rd SIAM International Conference on Data Mining, May 1-3, 2003, pp. 178-185. [pdf] |
|
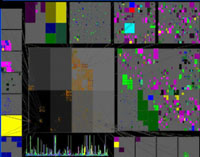 |
Computer Security Data Visualization
To ensure the security and performance of the Internet,
information visualization techniques can help characterize
network data, identify weakness in network connectivity, and detect
and explain actual anomalous events. Our research focuses
on interactive visualization of connectivity data, as well as
collected routing data and session data. BGPeep: An IP-space Centered View for Internet Routing Data. James Shearer, Kwan-Liu Ma, and Toby Kohlenberg. In Proceedings of VizSEC 2008, September 2008. [pdf, video] Analysis of BGP Origin AS Changes among Brazil-Related Autonomous Systems. Shih-Ming Tseng, Ke Zhang, Felix Wu, Kwan-Liu Ma, Soon Tee Teoh, and Xiaoliang Zhao. In Proceedings of Proceedings of the 7th IEEE International Workshop on IP Operations and Management (IPOM 2007). [DOI] Visualization of Santized Email Logs for Spam Analysis, Chris Muelder and Kwan-Liu Ma. In Proceedings of APVIS 2007. [DOI] Cyber Security through Visualization, Kwan-Liu Ma, in Proceedings of the 2006 Asia-Pacific Symposium on Infomration Visualization, pp. 3-7. [pdf] A Visualization Methodology for Characterization of Network Scans, Chris Muelder, Kwan-Liu Ma, and Tony Bartoletti, in Proceedings of Workshop on Visualization for Computer Security (VizSEC 2005), Visualization 2005 Conference, October 2005. [pdf] Interactive Visualization for Network and Port Scan Detection, Chris Muelder and Kwan-Liu Ma, RAID 2005, September 2005. [pdf] PortVis: A Tool for Port-Based Detection of Security Events, Jonathan McPherson, Kwan-Liu Ma, Paul Krystosek, Tony Bartoletti, Marvin Christensen, VizSEC 2004. [pdf] Detecting Flaws and Intruders with Visual Data Analysis, Soon tee Teoh, Kwan-Liu Ma, S. Felix Wu, and T. J. Jankun-Kelly. IEEE Computer Graphics and Application, 24(5), September/October 2004, pp. 27-35. [pdf, DOI] A Visual Exploration Process for the Analysis of Internet Routing Data, Soon Tee Teoh, Kwan-Liu Ma, and Felix Wu, in Proceedings of IEEE Visualization 2003 Conference, pp. 523-530. [pdf] Case Study: Interactive Visualization for Internet Security, Soon Tee Teoh, Kwan-Liu Ma, and Felix Wu, in Proceedings of IEEE Visualization 2002 Conference. [DOI] |
|
 |
Software Visualization
Managing large-scale software development and the understanding of large software systems present many research opportunities for information visualization.
How can visualization help understand the relationship betweeen the
communication between developers and the evolution of the source code?
Furthermore, program comprehension is key to software maintenance. How can visualization help understand programs in a way not complicated by scale and contextuality. Software Evolution Storylines. Michael Ogawa and Kwan-Liu Ma. In Proceedings of SoftVis 2010. [pdf] code_swarm: A Design Study in Organic Software Visualization. Michael Ogawa and Kwan-Liu Ma. IEEE Transactions on Visualization and Computer Graphics, 15(6), October 2009, pp. 1097-1104. (Also IEEE Vis 2009 Proceedings) [DOI] StarGate: A Unified, Interactive Visualization of Software Projects, Michael Ogawa et al., Proceedings of PacificVis 2008. [pdf] Stable, Flexible, Peephole Pretty-Printing, Stoney Jackson, Premkumar Devanbu, and Kwan-Liu Ma. Science of Computer Programming, Volume 72, Issues 1-2, June 2008, pp. 40-51. Visualizing Social Interaction in Open Source Software Projects, Michael Ogawa et al., Proceedings of APVIS 2007. [pdf] |
|
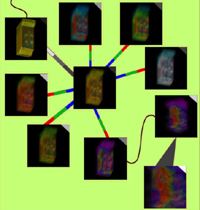 |
Visualizing Visualizations We develop visual interfaces that can help scientists keep track of their visualization experience and findings, use it to generate new visualizations, and share it with others. Publications:A Model and Framework for Visualization Exploration, T.J. Jankun-Kelly, Kwan-Liu Ma, and Michael Gertz, IEEE Transaction on Visualization and Computer Graphics, 13(2), March-April 2007, pp. 357-369. [DOI] A Model for the Visualization Exploration Process, T.J. Jankun-Kelly, Kwan-Liu Ma, and Michael Gertz, in Proceedings of the Visualization 2002 Conference. [pdf] Visualization Exploration and Encapsulation via a Spreadsheet-Like Interface, T.J. Jankun-Kelly and Kwan-Liu Ma, IEEE Transactions on Visualization and Computer Graphics, 7(3), July-September 2001, pp.275-287. [pdf] Visualizing Visualizations: User Interfaces for management and Exploration of Scientific Visualization Data, Kwan-Liu Ma, Visualization Viewpoints, IEEE Computer Graphics and Applications, September/October 2000. [pdf] Image Graphs - A Novel Interface for Visual Data Exploration, Kwan-Liu Ma, in Proceedings of the Visualization '99 Conference. [pdf] |
|