RESEARCH
My current research encompasses two distinctive but complementary areas: AI/ML and Visualization. The focus of our AI/ML work is to enhance the performance, transparency, and reliability of AI-based systems by (1) developing methods for data and model validation and for interpretability of model outputs; and (2) designing visualization interface for the usability of human-AI teaming systems. Our AIxVIS research is twofold. Visualization, as an interface, can help align AI with human value and foster trust. AI/ML can help enhance the visualization process by automating aspects of data analysis, guiding in the visualization design space, and optimizing visual outputs to improve user experience.
Our visualization research projects are largely driven by real-world applications found in areas from healthcare, social science, biological science, physical science, engineering design, to business and cybersecurity. We design visualization as an enabling tool for data-driven design, discovery, decision making, and storytelling. For example, my group has developed visualization solutions to assist decision-making in business based on customer data, fighting crime and fraud, detecting and tracking intrusions for network security, understanding large-scale scientific research data, analysis of biomedical image data for better medical diagnosis and surgical planning, supercomputing resource management and performance optimization, and many others.
Notably, to support scientific studies with supercomputing at extreme scale, my group has introduced novel in situ visualization solutions, and successfully demonstrated the feasibility and value of visually steering large-scale scientific simulations. The new visualization technologies my group has introduced help drastically raise scientists' productivity by allowing them to verify their data, uncover previously unknown information, and more effectively communicate with others their findings using visualization. To further enhance the value of visualization in the overall scientific workflow, we have been conducting usability studies, which allow us to identify areas for improvement. We have also addressed the need to support collaborative work by designing visualization interfaces for facilitating multichannel communication, as well as reusing and sharing data analysis strategies and results among participants.
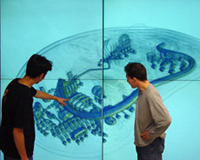
We also maintain a unique line of research in visualization for the public. We previously contributed to a collaborative effort transforming scientific research data into interactive visualization exhibits. These exhibits are presently on display at a science museum and help achieve a broader impact of scientific research. We currently have a collaborative project with scientists from environmental science and ecology aiming to design effective visualizations for communicating with both water policymakers and diverse community members about water resource management in California.
I continue to launch new threads of research in AI/ML and visualization. I welcome prospective students and collaborators to join our research endeavor. Students in my group usually need knowledge and skills in two or more of the following areas: AI/ML, visualization, computer graphics, human computer interaction, and high performance computing.
Specific research topic areas of interest include:
-
Enhancement of AI/ML Systems
We enhance the usability and reliability of AI-based systems with a human-centered design and data-centric strategies to foster human-AI collaboration and alignment of machine intelligence and human knowledge/value. We also develop intrepretation methodologies to support diagnosis and evaluation of AI systems. ,
Select Publications:
Towards Dataset-Scale and Feature-Oriented Evaluation of Text Summarization in Large Language Model Prompts. IEEE Transactions on Visualization and Computer Graphics 31(1): 481-491 (2025). Sam Yu-Te Lee et al. [DOI]
VISTA: A Visual Analytics Framework to Enhance Foundation Model-Generated Data Labels. IEEE Transactions on Visualization and Computer Graphics (2025). Xiwei Xuan et al. [Preprint]
SLIM: Spuriousness Mitigation with Minimal Human Annotations. ECCV (46):215-231 (2024). Xiwei Xuan et al. [DOI]
SUNY: A Visual Interpretation Framework for Convolutional Neural Networks from a Necessary and Sufficient Perspective. XAI4CV Workshop:8371-8376, CVPR 2024. Xiwei Xuan et al. [DOI]
Slicing, Chatting, and Refining: A Concept-Based Approach for Machine Learning Model Validation with ConceptSlicer. ACM Intelligent User Interfaces 2024:274-287. Xiaoyu Zhang et al. [DOI]
Opening the Black Box - Data Driven Visualization of Neural Network, IEEE Visualization 2005 Conference, pp. 383-390. Fan-Yin Tzeng et al. [DOI] -
Visualization Meets AI
We explore the opportunities to employ AI and machine learning in the process of data visualization and analytics, aiming to lower both human and computing costs while maintaining the desired quality/performance requirements. The other aim is to make optimal use of machine intelligence and human intelligence through an effective visualization interface. Combining machine learning and visual analytics can empower analysts' ability to interpret and discover from large, complex data, and to predict and make critical decisions.
Select Publications:
AttributionScanner: A Visual Analytics System for Metadata-Free Data-Slicing Based Model Validation. IEEE Transactions on Visualization and Computer Graphics (2025), Xiwei Xuan et al. [Preprint]
Photon Field Networks for Dynamic Real-Time Volumetric Global Illumination. IEEE Transactions on Visualization and Computer Graphics 30(1):975-985 (2024). David Bauer et al. [DOI]
Interactive Volume Visualization via Multi-Resolution Hash Encoding Based Neural Representation. IEEE Transactions on Visualization and Computer Graphics 30(8):5404-5418 (2024). Qi Wu et al. [DOI]
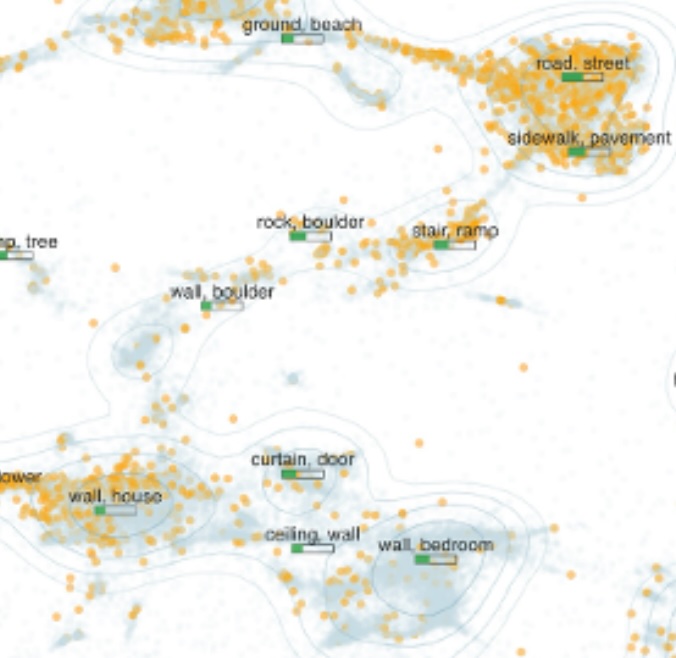
Visual Analytics for Efficient Image Exploration and User-Guided Image Captioning. IEEE Transactions on Visualization and Computer Graphics 30(6):2875-2887 (2024). Yiran Li et al. [DOI]
Visual Analytics of Neuron Vulnerability to Adversarial Attacks on Convolutional Neural Networks. ACM Transactions on Interactive Intelligent Systems 13(4):20;1-20:26 (2023), Yiran Li et al. [DOI]
Supporting Analysis of Dimensionality Reduction Results with Contrastive Learnin, IEEE Transactions on Visualization and Computer Graphics 26(1):45-55 (2020). Takanori Fujiwara et al. [DOI]
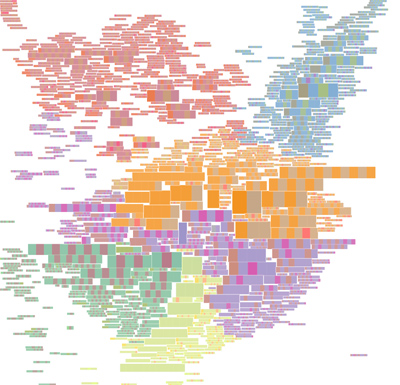
A Deep Generative Model for Graph Layout, IEEE TVCG 26(1):665-675 (2020). Oh-Hyun Kwon and Kwan-Liu Ma [DOI]
What Would a Graph Look Like in This Layout? A Machine Learning Approach to Large Graph Visualization, IEEE TVCG 24(1):478-488 (2018). Oh-Hyun Kwon, Tarik Crnovrsanin, Kwan-Liu Ma [DOI]
Intelligent Classification and Visualization of Network Scans, VizSEC 2007, pp. 237-253. Chris Muelder et al. [DOI]
An Intelligent System Approach to Higher-Dimensional Classification of Volume Data, IEEE TVCG 11(3):273-284 (2005). Fan-Yin Tzeng, Eric Lum, Kwan-Liu Ma. [DOI]
-
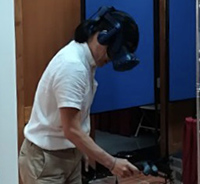
Immersive Visualization
The increasing quality and decreasing price of wearable VR devices inspires us to exploit the immersive space for data visualization and analysis. We are developing new immersive visualizaion applications, determining how to represent and lay out data in immersive space, and studying associated interaction problems. We also investigate the use of AR for collaborative visual analysis tasks.
Select Publications:
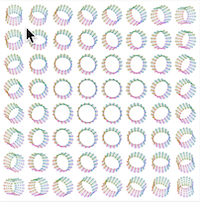
A Multi-Layout Design For Immersive Visualization of Hierarchical Network Data. IEEE ISMAR 2024. David Bauer et al.[DOI]
A Comparison of the Fatigue Progression of Eye-Tracked and Motion-Controlled Interaction in Immersive Space. IEEE ISMAR 2021. Lukas Masopust et al. [DOI]
Collaborative Visual Analysis with Multi-Level Information Sharing Using a Wall-size Display and See-Through HMDs. IEEE PacificVis 2019. Tianchen Sun et al. [DOI].
Improving Spatial Orientation in Immersive Environments, ACM SUI 2018. Joseph Kotlarek et al. [DOI]
A Study of Rendering, and Interaction Methods for Immersive Graph Visualization, IEEE Transactions on Visualization and Computer Graphics, 22(7):1802—1815, 2016. Oh‑Hyun Kwon, Chris Muelder, Kyungwon Lee, and Kwan‑Liu Ma [pdf]
Enabling Interactive Scientific Data Visualization and Analysis with See-through HMDs and a Large Tiled Display, in Proceedings of Workshop on Immersive Analytics, IEEE VR 2016. Ken Nagao, Yucong Ye, Chuan Wang, Issei Fujishiro, and Kwan-Liu Ma [pdf]
-
Big Data Visualization
We are entering a data-rich era. Advanced computing, imaging, and sensing technologies enable scientists to study natural and physical phenomena at unprecedented precision, resulting in an explosive growth of data. The size of the collected information about the Web and mobile device users is expected to be even greater. To make sense and maximize utilization of such vast amounts of data for knowledge discovery and decision making, we need a new set of tools beyond conventional data mining and statistical analysis. Visualization has been shown very effective in understanding large, complex data, and thus become an indispensable tool for many areas of research and practice. We have been developing new concepts to further advance the visualization technology as a powerful discovery and communication tool.
-
In Situ Data Analysis, Reduction, and Visualization
The ability to do data triage and visualization during a simulation run becomes more and more essential as scientific supercomputing moves from terascale and petascale to exascle. We have been studying the feasibility and requirements of in situ processing over the past few years. In situ analysis and visualization is clearly on our national research roadmap, and many others are joining us in this very important direction.
More Information -
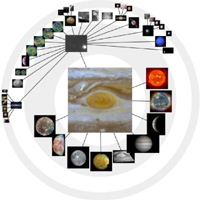
Information Visualization and Visual Analytics
Our research in information visualization focuses on very large graph visualization, visual data mining, social network analysis, software evolution, and computer security visualization. We are also interested in studying the information visualization aspect of scientific visualization problems.
More Information -
Scientific Storytelling
We aim to add to existing visualization systems the support for storytelling using illustrative visualizations, animations, annotations, and sound.
More Information -
Parallel & Distributed Visualization
Visualizing large, complex volume data demands parallel or Grid-based solutions. We intend to realize a fully parallelized visualization pipeline. We have developed scalable parallel rendering algorithms for a variety of volume data, designed highly efficient software and hardware image compositing solutions, and built clusters targeting large-scale visualization applications. Most of the performance studies have been done on the massively parallel computers operated at LANL, LBL, LLNL, and PSC.
More Information -
Visualization Interfaces
We develop visual interfaces that can help scientists keep track of their visualization experience and findings, use it to generate new visualizations, and share it with others. We also investigate how intelligent systems can assist sophisticated, time-consuming visualization tasks, and consequently simplify the user interfaces for performing the tasks.
More Information -
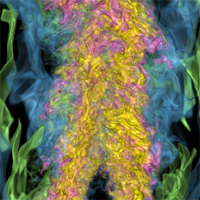
Expressive Visualization
We aim at improving the expressiveness of visualizations through the use of artistic inspired methods, non-photorealistic rendering techniques, and highly interactive user interfaces. Visualizations should be made by using the appropriate level of abstraction according to the purpose of visualization, and the visualizations should be perceptually effective to deliver the most relevant information in the data.
More Information -
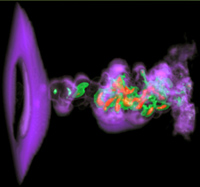
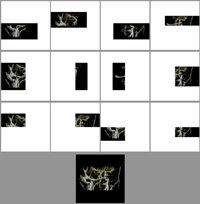
Volume Visualization
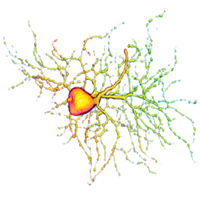
Volume data arises in a large subset of scientific, engineering, and biomedical applications. We aim to develop new methodologies for more efficient and effective volume segmentation and visualization.
More Information -
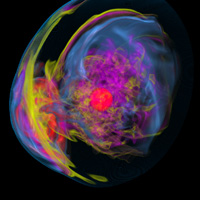
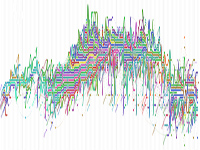
Time-Varying Volume Data Visualization
Time-varying data visualization presents some unique challenges. Our goal is to drastically improve the interactivity and explorability of large-scale, time-varying data visualization through the study and development of innovative data reduction methods, rendering and interaction techniques, and system integration strategies tailored to the characteristics of several representative leading-edge applications. Check out our new NSF ITR project.
More Information
Our research projects have been sponsored in part by Alibaba, Bosch Research, HP Labs, Nokia Research, AT&T Labs, NSF, NIH, DOE, NIST, and Air Force STTR.