|
|
AIX008: Introduction to Data Science: Summer 2022
Data exploration
The following hands-on exercises were designed to teach you step by step how to explore a simple data set given to you as a csv file. We will look at the standard data set that include characteristics of three types of penguins from Antartica.
The penguin data set
The Palmer Penguins dataset (created by by Dr. Kristen Gorman, Dr. Allison Horst, and Dr. Alison Hill) includes data
related to three penguin species (Adelie, Chinstrap and Gentoo) living in the northwest coast of the Antaractic peninsula.

For approximately 344 of those penguins, the dataset provides information on
their bill lengths and depths, their flippers lengths, their total mass, as well as their sexes,
island of origin, and species.
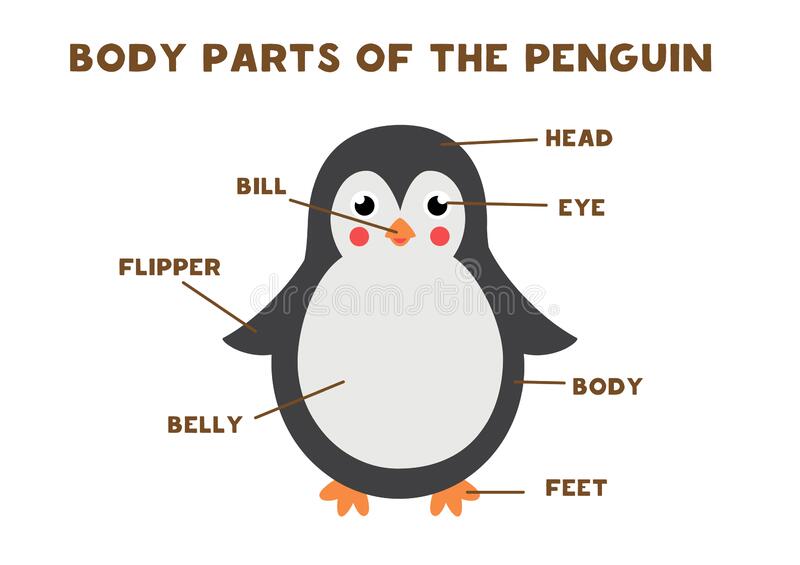
|
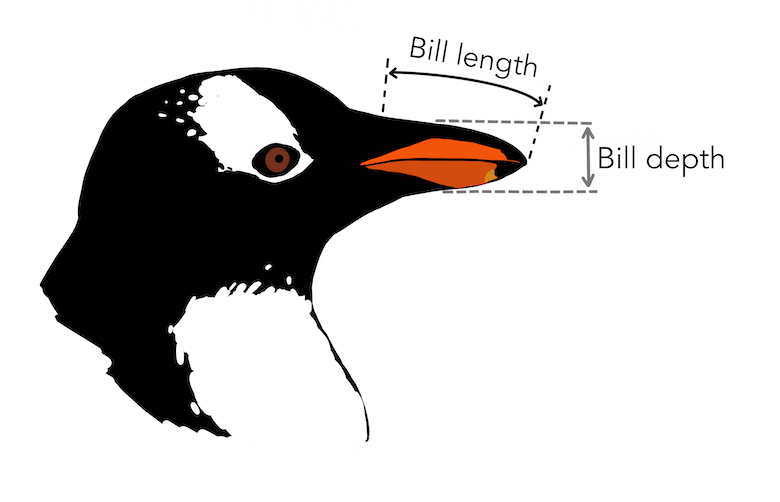
Measurements of a penguin bill
|
The question is: is it possible to define the specie and/or sex of a penguin based on these measurements?
The Palmer penguin dataset is available from the Internet at Penguins or lacally from : penguins.csv
After you saved this dataset locally, load it
>> penguins=readtable("penguins.csv")
Note that this will create a Matlab table. Type
The penguin data set: exploration. 1 Getting central measures
You will:
- Create six data arrays, Adelie Male, Adelie Female, Gentoo Male, Gentoo Female, Chinstrap Male, Chinstrap Female that are specific to each penguin species, separated by gender.
Example: create a table specific to Gentoo males, and extract data:
>> var = penguins.Properties.VariableNames;
>> Gentoo=penguins(penguins.species=="Gentoo",var)
>> GentooMale=Gentoo(Gentoo.sex=="male",var)
>> DataGentooMale=[GentooMale.bill_length_mm GentooMale.bill_depth_mm GentooMaleflipper_length_mm GentooMale.body_mass_g];
Careful!! There might be missing data. Think about how to remove them!
- Compute the statistics (mean, standard deviation) for each measurement, for each penguin species.
Fill up the table:
| |
Adelie |
Gentoo |
Chinstrap |
| |
Male |
Female |
Male |
Female |
Male |
Female |
| Measure |
Mean |
Std.
Deviation |
Mean |
Std.
Deviation |
Mean |
Std.
Deviation |
Mean |
Std.
Deviation |
Mean |
Std.
Deviation |
Mean |
Std.
Deviation |
| Bill length |
|
|
|
|
|
|
|
|
|
|
|
|
| Bill depth |
|
|
|
|
|
|
|
|
|
|
|
|
| Flipper length |
|
|
|
|
|
|
|
|
|
|
|
|
| Weight |
|
|
|
|
|
|
|
|
|
|
|
|
The penguin data set: exploration. 2 Visualization
While central measure information about the data are useful, visualizing the data is often more important. We are goind to generate
a few plots about those data, hopefully learning if some features may identify species / sex of the penguins.
- A first simple plot is to visualize the number of penguins. Here is a simple code to do that (I assume that the data array mentioned
above have been generated).
>> nadelie = max(size(DataAdelieMale)) + max(size(DataAdelieFemale));
>> ngentoo = max(size(DataGentooMale)) + max(size(DataGentooFemale));
>> nchinstrap = max(size(DataChinstrapMale)) + max(size(DataChinstrapFemale));
>>
>> npenguins = [nadelie ngentoo nchinstrap];
>> x=[1 2 3];
>> bar(x,[npenguins(1) nan nan],'FaceColor','r');
>> hold on
>> bar(x,[nan npenguins(2) nan],'FaceColor','b');
>> bar(x,[nan nan npenguins(3)],'FaceColor','g');
>> set(gca,'XTickLabel',{'Adelie','Gentoo','Chinstrap'})
>> ylabel('Number of penguins')
>>
And here is the plot:
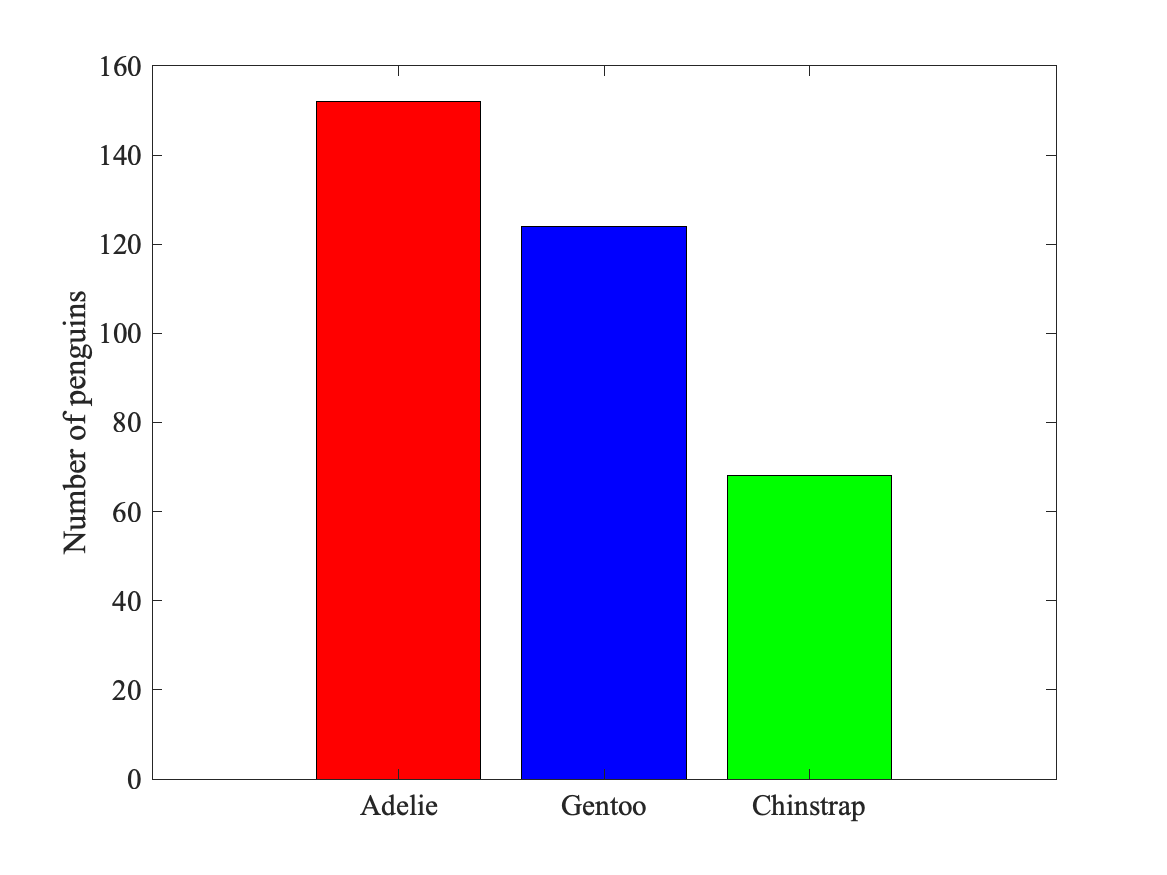
There is more data available about Adelie and Gentoo penguins than there are of Chinstrap penguins. How about male vs female penguins? Generate a similar plot but with six bars, to show the numbers of penguins for each specie AND each gender.
- Now we can compare the measurements for the different penguins. Let us first look if penguins differ based on their bill length and flipper length. The simple code below generates a plot of the flipper length against the bill length for Adelie penguins (red) and Gentoo penguins (in blue).
>> DataGentoo=[Gentoo.bill_length_mm Gentoo.flipper_length_mm];
>> DataAdelie=[Adelie.bill_length_mm Adelie.flipper_length_mm];
>> figure
>> plot(DataAdelie(:,1),DataAdelie(:,2),'or','LineWidth',1.5)
>> hold on
>> plot(DataGentoo(:,1),DataGentoo(:,2),'ob','LineWidth',1.5)
>> xlabel('Bill length (mm)')
>> ylabel('Flipper length (mm)')
>> legend('Adelie','Gentoo')
>>
And here is the plot:
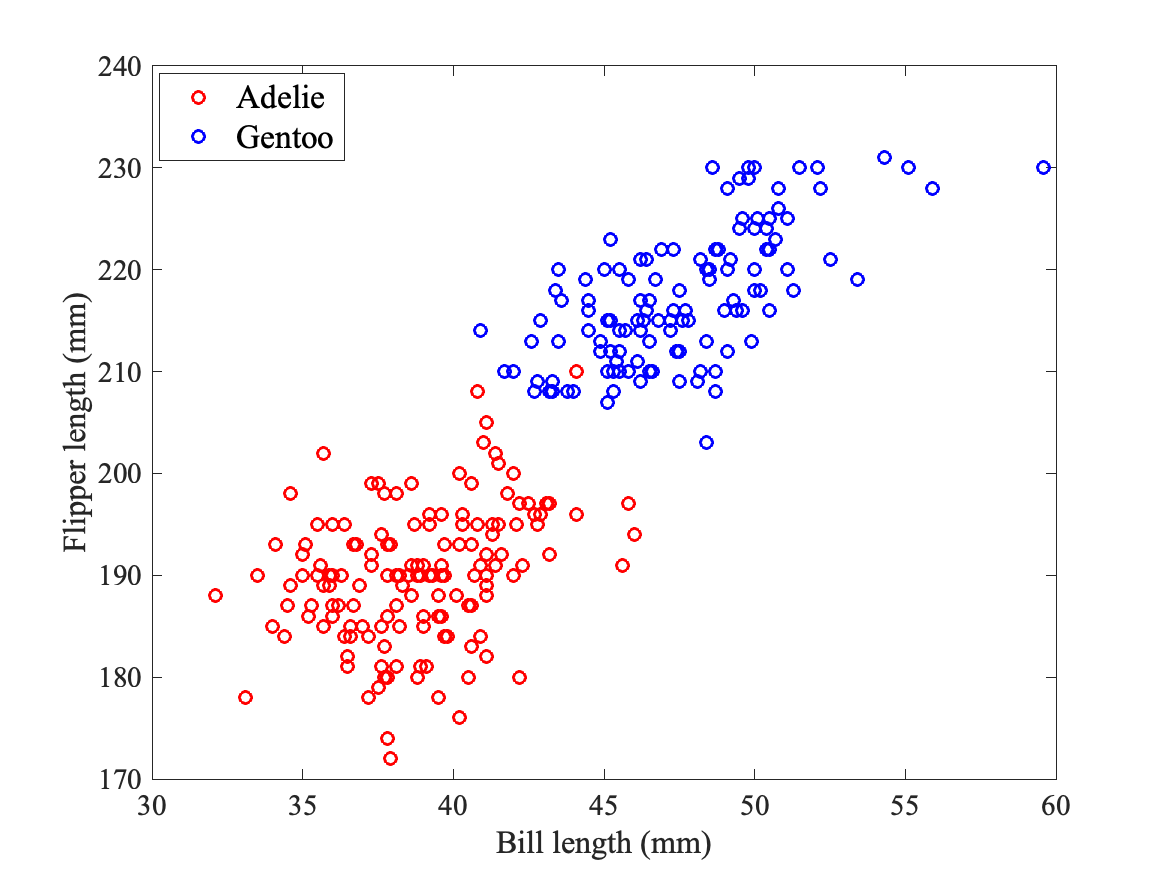
The scatterplot proves that the Adelie penguins have shorter bills and flippers compared to the Gentoo penguins. How about the Chinstrap penguins? Are there differences between male and female penguins? Generate some plots to try and answer these questions.
- Let us look now at the distributions of weights of the different penguins. The simple code below generates a boxplot of those distributions for Adelie penguins (red) and Gentoo penguins (in blue). Note that you will need to download first boxplotx.m and optndfts.m if the toolbox "Statistics and Machine Learning" is not installed. If this toolbox is installed, please check the documentation for the function "boxplot".
>> MassGentoo=[Gentoo.body_mass_g];
>> MassAdelie=[Adelie.body_mass_g];
>> x={MassAdelie,MassGentoo};
>> figure
>> boxplotx(x,'xpos',[1,4],'labels',{'Adelie','Gentoo'},'lines',{'r-','b-'},'width',[1,1],'rotation',0.);
>> ylabel('Mass (g)')
>>
And here is the plot:
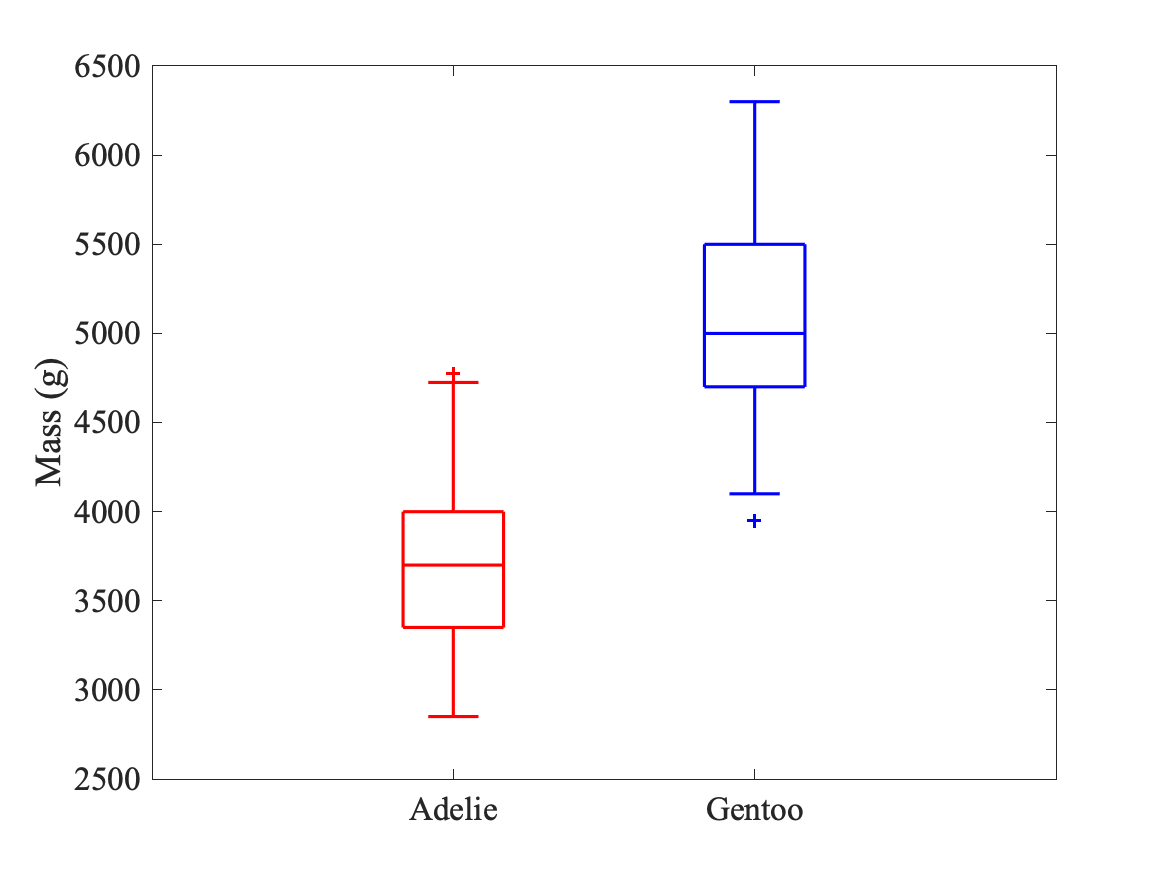
The boxplot shows that the Adelie penguins are usually heavier than the Gentoo penguins. How about the Chinstrap penguins? Are there differences between male and female penguins? Generate some boxplots to try and answer these questions.
Boxplots are summary plots. Represent the same information using histograms and/or violin plots.
|


