|
|
AIX008: Introduction to Data Science: Summer 2022
The following hands-on exercises were designed to teach you step by step how to perform and understand various clustering algorithms. We will look at one standard data set, the Penguin data set, as well as a diffcult clustering problem, the spiral .
The penguin data set
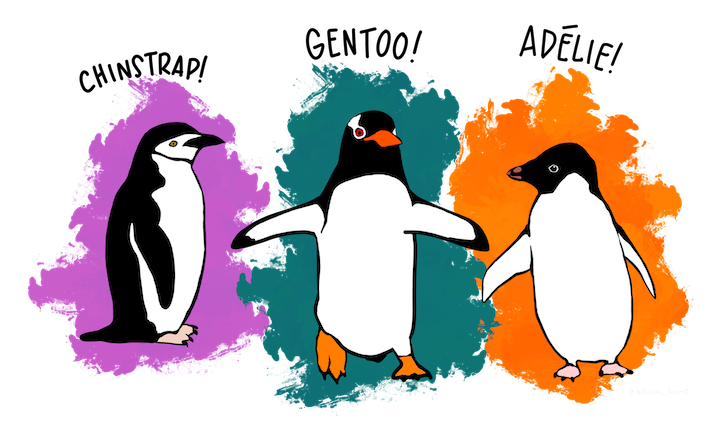
The Palmer Penguins dataset (created by by Dr. Kristen Gorman, Dr. Allison Horst, and Dr. Alison Hill) includes data
related to three penguin species (Adelie, Chinstrap and Gentoo) living in the northwest coast of the Antaractic peninsula.
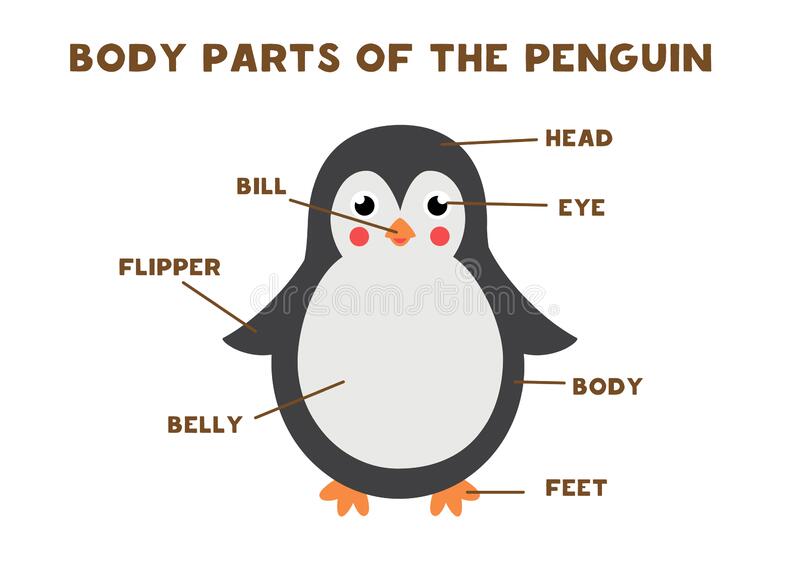
For approximately 344 of those penguins, the dataset provides information on
their bill lengths and depths, their flippers lengths, their total mass, as well as their sexes,
island of origin, and species.
|
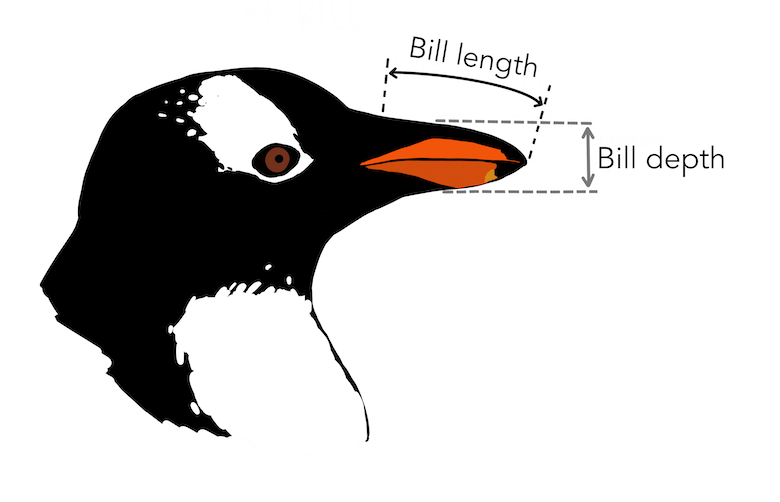
Measurements of a penguin bill
|
The question is: is it possible to define the specie a penguin based on these measurements?
The Palmer penguin dataset is available from the Internet at Penguins or lacally from : penguins.csv
After you saved this dataset locally, load it
>> penguins=readtable("penguins.csv")
Note that this will create a Matlab table. Type
to "see" the table. Note that there might be missing data, which needs to be removed!
Clustering the penguin data set: find the species
You will:
- Create one data array, that contains the data on the penguins bill lengths and depths, their flippers lengths, and their total mass.
Note that this data array contains information on 342 penguins (i.e. 342 rows), and 4 different features, (i.e. 4 columns). You will
call this array "data". (MATLAB script if you need it: gendata.m)
- Creata one array that contains the species of the penguins You will call this array "species".
We will cluster the 342 penguins into 3 clusters, and compare the results with the actual species of these penguins.
There are (at least) two cluster methods implemented in Matlab:
- Hierarchical clustering: use the function clusterdata. The basic syntax for this function is:
>> idx = clusterdata(meas,'distance',dist_method,'linkage', link_method,'maxclust',Nclust)
where:
- 'distance' specifies the method used to measure the similarity of two measurements. Standard values for 'Distance' are 'euclidean','correlation', 'cosine'
- 'linkage' specifies the linkage method used to compute the distance between two clusters. Standard methods include 'single','average', and 'complete'.
- 'maxclust' is the number of clusters expected
- 'idx' is the array of cluster assignment for each data point (in our case, irises), after clustering.
For example,
>> Idx = clusterdata(data,'distance','euclidean','linkage', 'single','maxclust',3)
will cluster the data using the Euclidian distance to compare data points, single linkage to compare clusters, and output 3 clusters.
- kmeans clustering: use the function kmeans. The basic syntax for the function is:
idx = kmeans(meas,K,'Distance',dist_method)
where:
- K is the number of clusters
- 'Distance' specifies the method used to measure the similarity of two measurements. Standard values for 'Distance' are 'sqEuclidean','correlation', 'cosine'
- 'idx' is the array of cluster assignment for each data point (in our case, penguins), after clustering.
For example,
Idx = kmeans(data,3,'Distance','correlation')
will cluster the data using k-means, with k set to 3 clusters, and using correlation to compare data points.
Once the penguins have been clustered, we need to compare the cluster assignments of the irises with their actual species. Useful tools for this include:
- crosstab
crosstab(idx,species) will build a matrix C of size Ncluster x 3, with C(i,j) gives the number of elements of cluster I that belongs to specie j.
- randindex
R=randindex(idx,species)gives an Index of quality for the two partitioning of the data, idx (from the clustering technique), and species. Note that randindex is not a Matlab built in function. You can get it from here.
Experiment with the different clustering techniques. Fill in this table:
| Technique |
Distance |
Linkage |
RandIndex |
| Hierarchical |
Euclidean |
Single |
|
| Hierarchical |
Euclidean |
Average |
|
| Hierarchical |
Euclidean |
Complete |
|
| Hierarchical |
Correlation |
Single |
|
| Hierarchical |
Correlation |
Average |
|
| Hierarchical |
Correlation |
Complete |
|
| K-means |
sqEuclidean |
|
|
| K-means |
Correlation |
|
|
| K-means |
Cosine |
|
|
Which method works "best"?
For this method, plot the silhouette for each penguin, organized in clusters.
Clustering the spiral dataset
Some examples:
The spiral dataset corresponds to three intertwined spirals, each with approximately 100 points. This dataset is usually considered difficult to cluster, as each spiral is not “convex”; we will come to what it means later. You will attempt to cluster this data set using hierarchical clustering
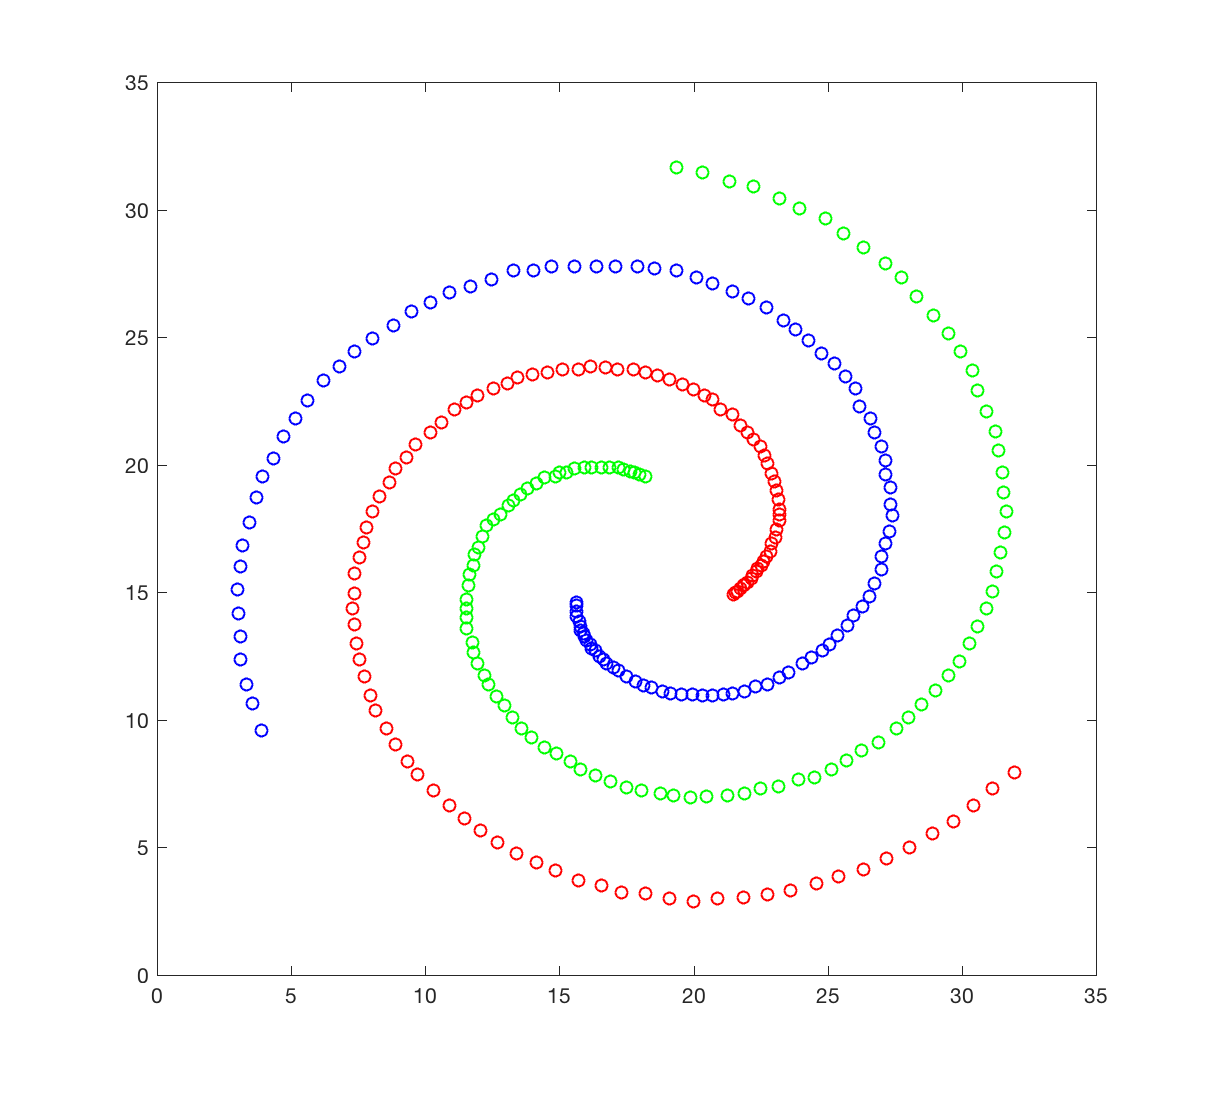
The spiral dataset is available in the file spiral.crd. This file contains two columns, corresponding to the X and Y coordinates of the 312 data points in the dataset. Points 1 to 106 belongs to spiral 1 (red), 107 to 207 to spiral 2 (green), and 208 to 312 to spiral 3 (blue).
- Generate a figure that resembles the figure shown above.
- Generate on a single page 4 subplots, each showing the results of clustering the spiral dataset, using a different linkage definition. I advise that you try: 'single','average', 'complete' and 'ward'. Explain what you obtain. You may want to quantify the quality of the clustering you obtain using the function randindex.
|