|
|
Modeling and Data Analysis in Life Sciences: 2017
Lab5: Fourier Analysis
We all use Fourier analysis without even knowing it: cell phones, DVDs, images, all involve Fourier transforms in one form or another. This lab includes one exercise that illustrates the computation and interpretation of Fourier analysis for a time signal (Touch-tone dialing).
Handouts
Fourier analysis:
Word document (click to download)
or
PDF document (click to download)
Exercise 1: Touch-tone dialing
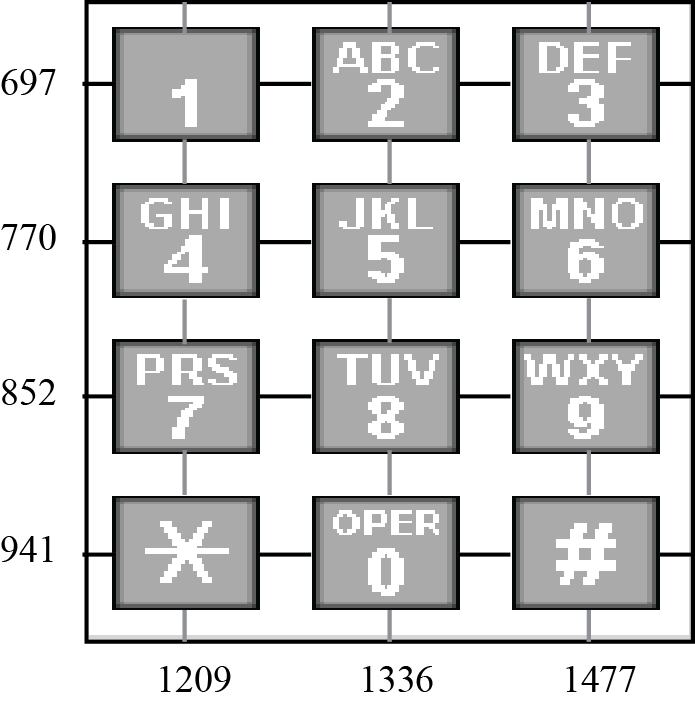
The basis for touch-tone dialing on a phone is the Dual Tone Multi Frequency (DTMF) system. Basically, the telephone-dialing pad acts as a 4x3 matrix (see figure 1 below).
 |
| Figure 1: Telephone keypad |
A frequency is associated with each row and each column. These base frequencies are:
frow = [ 697 770 852 941 ]
fcol = [ 1209 1336 1477]
- Generating the tone signal corresponding to a specific button
The tone generated by the button at position (i,j) is obtained by superposing the two fundamental tones with frequencies frow(i) and fcol(j). Let us look for example at the signal corresponding to the button "5". The Matlab code for generating this signal will look like:
% First, we need to set than sampling rate:
Fs = 8192;
% Second, we set a vector of points in the time interval [0 0.25s]
% at this sampling rate:
t = 0: 1/Fs : 0.25;
% The tone generated by the button 5 is the sum of the fundamental signals
% with frequencies frow(2) and fcol(2):
y1 = sin(2*pi*frow(2)*t);
y2 = sin(2*pi*fcol(2)*t);
y = (y1+y2)/2;
% If you want to play that tone, use the command:
sound(y,Fs);
Problem: Write a small Matlab function, gentone, that generates the tone associated with any key N, where N is between 0 and 9.
- Decoding a phone number
An important question related to telephony: is it possible to determine a phone number by simply listening to its signal?
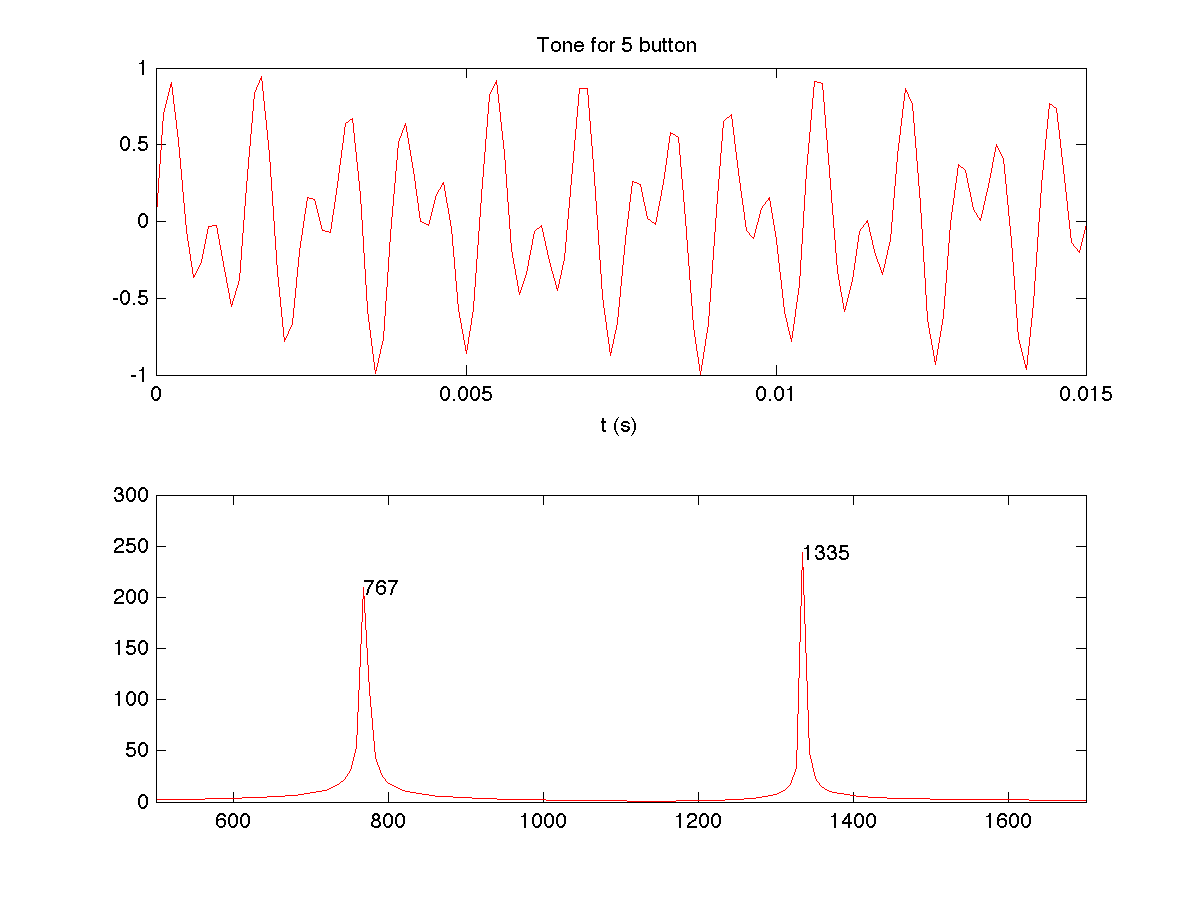
Let us consider again the signal corresponding to the button 5. Figure 2A shows the signal generated by the program given above, in the time interval [0 0.015s]. Note that in this representation, it is difficult to identify the two fundamental tones that make up this signal. It is possible however to identify these tones by performing a Fourier series analysis of the signal: figure 2B shows the Fourier coefficients corresponding to this signal in the frequency range corresponding to the DTMF frequencies. Cleary, this signal contains two fundamental tones, at frequencies 770 and 1336, and therefore corresponds to the button 5.
 |
| Figure 2: The signal for the "5" button and its Fourier analysis. |
The code for generating this figure is:
%
% Subplot 1: time signal
%
figure;
subplot(2,1,1);
plot(t,y,'-r')
%
% limit to first 0.015 s
%
axis([0 0.015 -1 1]);
xlabel('t (s)');
title('Tone for 5 button');
%
% Subplot 2: Fourier series
%
subplot(2,1,2)
%
% Compute Fourier series
%
p = abs(fft(y));
n = length(y);
%
% Get corresponding frequency values
%
f = (0:n-1)*(Fs/n);
plot(f,p);
axis([500 1700 0 300]);
%
% Find peak position
%
[peak_amp peak_loc]=findpeaks(p,'Minpeakheight',200);
%
% peak_loc is in point; convert to frequency
%
freq=f(peak_loc);
%
% Only keep values in DTMF range
%
peak_freq=freq(freq < 1700);
peak_height = peak_amp(freq < 1700);
%
hold on
str=num2str(int32(peak_freq));
text(peak_freq(1),peak_height(1),str(1));
text(peak_freq(2),peak_height(2),str(2));
Problem: The file phone.dat contains the signal recorded when a 11-digit phone number is dialed. Analyze this signal and identify the phone number.
|


